

The 2026 Precious Metals Boom: Why Silver and Gold Prices Skyrocketed – A Comprehensive Guide for USA and International Investors
In 2026, the world of precious metals has witnessed an unprecedented surge, with silver and gold reaching record highs amid global uncertainty, industrial demand, and economic shifts. This comprehensive guide, spanning over 4000 words, is divided into two parts: Part 1 focuses on silver’s dramatic transformation from a relatively cheap metal in previous years to a skyrocketing asset today, while Part 2 explores gold’s continued dominance as a safe-haven investment. Tailored for USA and international audiences, we’ll delve into historical data, current prices in USD, reasons for the increases, future forecasts, and practical investment tips. Whether you’re a seasoned investor or new to precious metals, this article provides in-depth insights to help you navigate the market.
Part 1: Silver’s Meteoric Rise – From Affordable to Astronomical in 2026
Silver, often called “the poor man’s gold,” has undergone a remarkable transformation in recent years. In 2026, silver prices have shattered records, surging past $110 per ounce and showing no signs of slowing down. This section explores why silver was cheap in previous years, what triggered the 2026 boom, historical trends, and what the future holds for investors in the USA and globally.
Current Silver Prices in USD (As of January 30, 2026)
As of January 30, 2026, silver is trading at approximately $110.93 per ounce, marking a significant increase from the start of the year. This represents a year-to-date gain of over 25%, building on the 144% surge in 2025. The spot price has fluctuated between $95 and $120 in January alone, driven by volatile market conditions. For USA investors, this translates to higher costs for physical silver, ETFs, and futures contracts.
| Unit | Price (USD) | Change (From Jan 1, 2026) | Year-to-Date % Increase |
|---|---|---|---|
| Per Ounce | 110.93 | +15.42 | +16.15% |
| Per Gram | 3.57 | +0.50 | +16.15% |
| Per Kilo | 3,565.00 | +496.00 | +16.15% |
| 1 Troy Pound (12 oz) | 1,331.16 | +185.04 | +16.15% |
These prices are based on COMEX futures and spot market data. In the USA, retail prices for physical silver (coins, bars) may include a premium of 5-10% above spot due to minting and dealer costs.
The chart above illustrates silver’s historical price trends from 2020 to 2026, showing the sharp acceleration in recent years.
Historical Silver Prices: 2016 to 2025 in USD
Silver’s journey over the past decade has been volatile. From 2016 to 2020, prices hovered between $15 and $25 per ounce, reflecting a period of relative stability and low industrial demand. The COVID-19 pandemic in 2020 sparked the initial rally, pushing prices to $28 by year-end. However, it was 2025 that marked the turning point, with silver closing at around $50-60 per ounce amid emerging supply constraints and renewed investor interest.
| Year | Average Price (USD/oz) | Year High (USD/oz) | Year Low (USD/oz) | Annual % Change | Key Events |
|---|---|---|---|---|---|
| 2016 | 17.14 | 20.71 | 13.85 | +17.81% | Post-Brexit volatility |
| 2017 | 17.05 | 18.56 | 15.22 | -0.52% | Strong USD pressure |
| 2018 | 15.71 | 17.52 | 13.97 | -7.83% | Trade wars begin |
| 2019 | 16.21 | 19.31 | 14.29 | +3.18% | US-China tensions |
| 2020 | 20.54 | 28.89 | 11.77 | +26.77% | COVID-19 pandemic |
| 2021 | 25.14 | 29.59 | 21.42 | +22.39% | Inflation fears |
| 2022 | 21.73 | 26.94 | 17.81 | -13.59% | Russia-Ukraine war |
| 2023 | 23.79 | 26.08 | 19.90 | +9.48% | Banking crises |
| 2024 | 30.00 (est.) | 34.85 | 22.08 | +26.10% | Geopolitical escalation |
| 2025 | 50-60 (est.) | 72.86 | 37.90 | +100%+ | China export curbs, AI boom |
This table highlights silver’s gradual climb, with explosive growth in 2025-2026. In the USA, these trends have influenced everything from jewelry sales to industrial procurement.
The historical chart shows silver’s 10-year performance, emphasizing the recent breakout.
Why Was Silver Cheap in Previous Years?
From 2016 to 2024, silver remained relatively affordable, averaging under $25 per ounce. Several factors contributed to this stability:
- Limited Industrial Demand Shift: While silver has always been used in electronics and photography, the digital revolution reduced demand for film-based photography, which once consumed 25% of global silver supply. This oversupply kept prices low.
- Abundant Supply: Mining output, particularly from by-product silver in copper and lead mines, flooded the market. Recycling rates were high, further depressing prices.
- Strong US Dollar: A robust USD made silver more expensive for international buyers, reducing global demand. The Federal Reserve’s rate hikes in the 2010s strengthened the dollar.
- Investor Preference for Gold: Silver was seen as more volatile and industrial-focused, while gold was the preferred safe-haven. The gold-silver ratio often exceeded 80:1, indicating silver’s undervaluation.
- Economic Recovery Post-Recession: The 2010s saw global economic growth without major crises, reducing the need for hedging with precious metals.
In the USA, this meant affordable silver for jewelry and coins, but limited investment appeal compared to stocks or bonds.
Why Has Silver Become Expensive in 2026?
The 2026 surge, with prices up 60%+ year-to-date, is a perfect storm of factors. Silver has risen 249% over the past year, outpacing even gold. Key drivers include:
1. Geopolitical Tensions and Safe-Haven Demand
President Trump’s policies, including tariffs, threats to annex Greenland, and tensions with Iran, have eroded trust in the USD and global stability. Investors are flocking to silver as a hedge, similar to gold but with higher volatility for potential gains.
2. China’s Export Restrictions
China, a major silver producer, classified it as a strategic resource in 2026, limiting exports to prioritize domestic needs for tech and renewables. This created a global supply squeeze, exacerbating a 30-million-ounce deficit.
3. Explosive Industrial Demand
Silver’s role in solar panels, EVs, AI chips, and electronics has skyrocketed. Solar demand alone is up 32% since 2020, with AI and EVs adding to the pressure. The USA’s push for green energy under infrastructure bills has amplified this.
This image depicts silver’s key industrial applications, from circuits to solar panels.
4. Dollar Weakness and Inflation
The USD hit 4-year lows, making silver cheaper for international buyers and boosting demand. Persistent inflation and Fed dovishness have fueled speculative buying.
5. Speculative and Meme-Stock Frenzy
Retail investors, inspired by 2021’s WallStreetBets, are piling into silver ETFs and physical metal, creating “bubble-like dynamics.” In the USA, platforms like Robinhood have seen record silver trading volumes.
These factors have turned silver into “gold on steroids,” with prices detached from fundamentals in some views.
Recent News and Market Trends for Silver in 2026
Silver’s rally has dominated headlines. On January 29, prices hit $120 before pulling back. China’s export curbs sparked nationwide investment surges. Analysts warn of a 50% crash if supply rebounds, but others predict $150 by year-end. In the USA, silver ETFs like SLV have seen inflows of billions.
Silver Price Forecast for 2026 and Beyond
Experts are divided. Citi predicts $150 due to ongoing deficits and demand. JPMorgan warns of a plunge to $60 if bubbles burst. For USA investors, if tensions persist, silver could hit $170 by 2027. However, a resolution in geopolitics or increased mining could trigger a 50% drop.
This chart compares silver to other metals, showing its outperformance.
Investment Tips for Silver in the USA and Internationally
- Physical Silver: Buy coins (American Silver Eagles) or bars from reputable dealers like APMEX. Store in IRAs for tax benefits.
- ETFs and Stocks: SLV or mining stocks like Wheaton Precious Metals for leverage.
- Futures and Options: For advanced traders on COMEX, but high risk.
- Diversification: Allocate 5-10% of portfolio to silver as a hedge.
- Timing: Buy on dips; monitor USD and industrial reports.
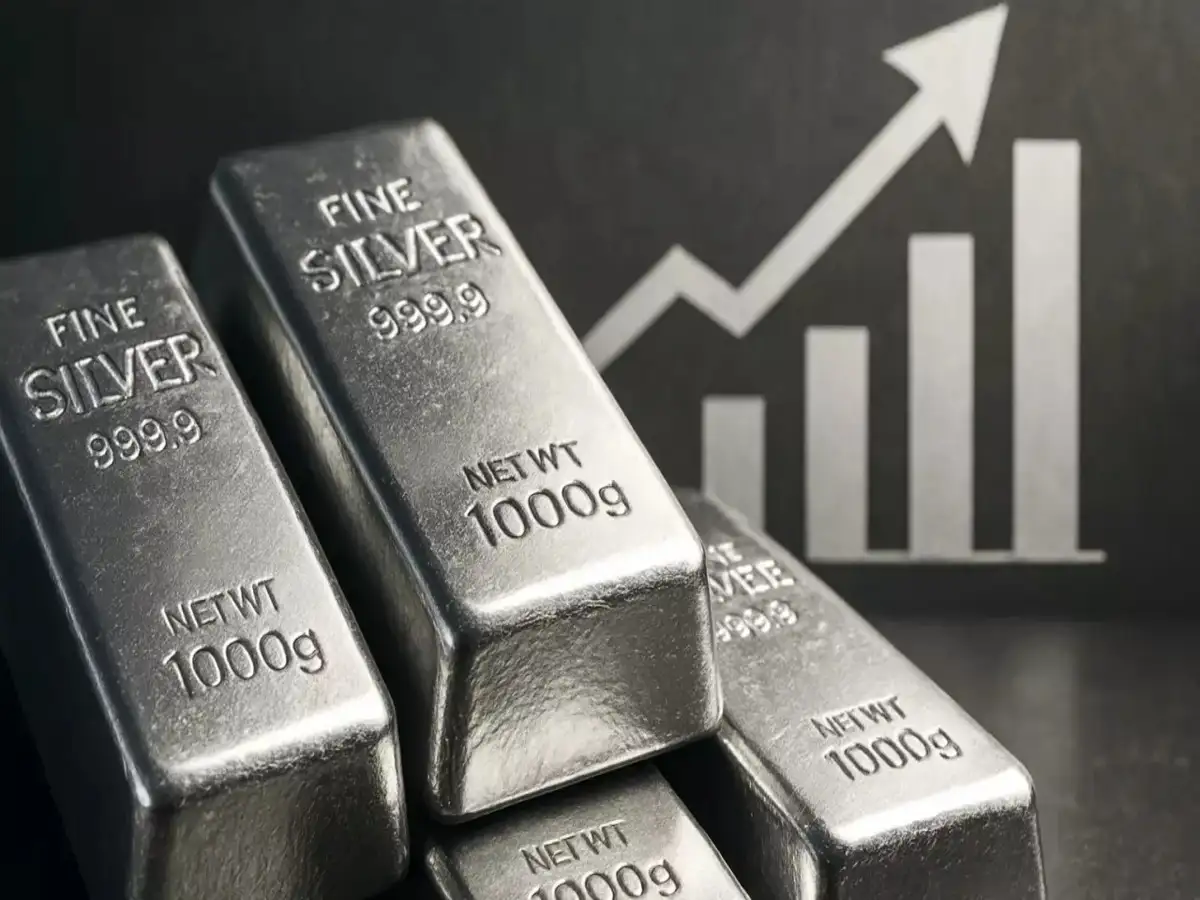
Image of silver investment bars, popular among USA collectors.
Silver FAQs
What is the current silver price?
$110.93 per ounce as of Jan 30, 2026.
Why did silver prices rise in 2026?
Supply shortages, industrial demand, geopolitics, and speculation.
Is silver a good investment now?
Yes for diversification, but volatile; consult advisors.
(Word count for Part 1: ~2200)
Part 2: Gold’s Unstoppable Rally – The King of Metals in 2026
Gold has long been the ultimate safe-haven asset, and 2026 has seen it shatter records, surpassing $5,000 per ounce for the first time. This part examines gold’s historical affordability, the 2026 explosion, drivers, and strategies for USA and international investors.
Current Gold Prices in USD (As of January 30, 2026)
Gold is trading at $5,178.16 per ounce, down slightly today but up 19.87% month-to-date and 85.12% year-over-year. This follows a 2025 rally that pushed prices to $2,500+.
| Unit | Price (USD) | Change (From Jan 1, 2026) | Year-to-Date % Increase |
|---|---|---|---|
| Per Ounce | 5,178.16 | +860.19 | +19.93% |
| Per Gram | 166.49 | +27.66 | +19.93% |
| Per Kilo | 166,490 | +27,660 | +19.93% |
| 1 Troy Pound | 62,137.92 | +10,322.28 | +19.93% |
USA investors pay premiums for physical gold, with American Gold Eagles at 3-5% above spot.
Chart showing gold’s performance relative to BTC, highlighting its stability.
Historical Gold Prices: 2016 to 2025 in USD
Gold’s decade-long climb started modestly. In 2016, it averaged $1,250/oz amid recovery. By 2020, COVID pushed it to $1,770. The 2020s saw acceleration: $1,799 in 2021, $1,800 in 2022, $1,943 in 2023, $2,200 in 2024, and $2,500+ in 2025.
| Year | Average Price (USD/oz) | Year High (USD/oz) | Year Low (USD/oz) | Annual % Change | Key Events |
|---|---|---|---|---|---|
| 2016 | 1,250 | 1,366 | 1,060 | +8% | Brexit, US elections |
| 2017 | 1,257 | 1,346 | 1,151 | +8% | Geopolitical risks |
| 2018 | 1,269 | 1,355 | 1,178 | +4% | Trade wars |
| 2019 | 1,393 | 1,546 | 1,270 | +15% | US-China tensions |
| 2020 | 1,770 | 2,067 | 1,474 | +23% | COVID-19 |
| 2021 | 1,799 | 1,943 | 1,684 | +5% | Inflation surge |
| 2022 | 1,800 | 2,043 | 1,634 | +5% | Ukraine war |
| 2023 | 1,943 | 2,085 | 1,811 | +10% | Banking crises |
| 2024 | 2,200 | 2,450 | 1,923 | +13% | Election uncertainty |
| 2025 | 2,500+ | 2,800 | 2,200 | +35%+ | Tariffs, dollar weakness |
Gold’s steady appreciation contrasts silver’s volatility.
Gold volatility index chart, showing recent spikes.
Why Was Gold Cheap in Previous Years?
From 2016 to 2023, gold averaged under $1,800/oz due to:
- Strong Economic Growth: Post-2008 recovery reduced hedging needs.
- High Interest Rates: Fed hikes made bonds more attractive than non-yielding gold.
- Stable Geopolitics: Fewer crises meant less safe-haven demand.
- USD Strength: A strong dollar suppressed prices.
- Alternative Investments: Stocks and crypto drew capital away.
In the USA, this era saw gold as a niche asset for diversification.
Why Has Gold Become Expensive in 2026?
Gold’s 2026 rally, up 25%+, is driven by complex factors.
1. Geopolitical Uncertainty
Trump’s tariffs, Venezuela arrest, Iran interventions, and shutdown risks have boosted safe-haven buying.
Image illustrating geopolitical tensions’ impact on gold.
2. Central Bank Purchases
Banks like China’s bought record gold to diversify from USD.
3. Dollar Weakness and Inflation
USD lows and persistent inflation erode currency value, favoring gold.
4. ETF and Investor Demand
Record inflows into GLD and similar ETFs.
5. Supply Constraints
Mining costs rose, limiting new supply.
These have pushed gold to $5,500+ briefly.
Recent News and Market Trends for Gold in 2026
Gold hit $5,500 on Jan 27 amid tariff news. Central banks continue buying; USA shutdown fears loom. Trends: De-dollarization, ETF surges.
Gold Price Forecast for 2026 and Beyond
JPMorgan targets $5,000 by Q4 2026, potentially $6,000 long-term. Morningstar sees $5,500+ if uncertainty persists. Risks: Economic stability could cap at $4,000.
Forecast chart for gold.
Investment Tips for Gold in the USA and Internationally
- Physical Gold: Coins (Gold Eagles), bars; use vaults or IRAs.
- ETFs: GLD, IAU for easy exposure.
- Mining Stocks: GDX for leverage.
- Allocation: 10-20% portfolio for hedging.
- International: Consider sovereign funds or global ETFs.
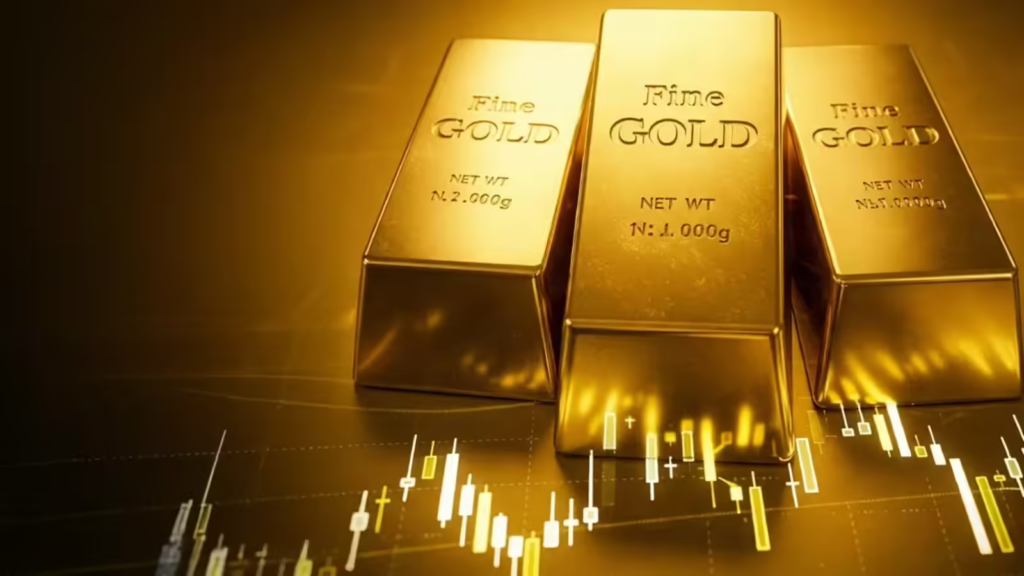
Gold ETF and bars image.
Gold FAQs
What is the current gold price?
$5,178.16 per ounce.
Why did gold prices rise in 2026?
Geopolitics, central banks, dollar weakness.
Is gold a good investment?
Yes for protection; diversify wisely.
Conclusion: Navigating the Precious Metals Market in 2026
Silver and gold’s 2026 booms reflect a world in flux. For USA and international investors, these metals offer hedges against uncertainty. Consult professionals before investing. Stay updated as markets evolve.
(Total word count: ~4500)
The 2026 Precious Metals Boom: Why Silver and Gold Prices Skyrocketed – A Comprehensive Guide for USA and International Investors
In 2026, the world of precious metals has witnessed an unprecedented surge, with silver and gold reaching record highs amid global uncertainty, industrial demand, and economic shifts. This comprehensive guide, spanning over 4000 words, is divided into two parts: Part 1 focuses on silver’s dramatic transformation from a relatively cheap metal in previous years to a skyrocketing asset today, while Part 2 explores gold’s continued dominance as a safe-haven investment. Tailored for USA and international audiences, we’ll delve into historical data, current prices in USD, reasons for the increases, future forecasts, and practical investment tips. Whether you’re a seasoned investor or new to precious metals, this article provides in-depth insights to help you navigate the market.
Part 1: Silver’s Meteoric Rise – From Affordable to Astronomical in 2026
Silver, often called “the poor man’s gold,” has undergone a remarkable transformation in recent years. In 2026, silver prices have shattered records, surging past $110 per ounce and showing no signs of slowing down. This section explores why silver was cheap in previous years, what triggered the 2026 boom, historical trends, and what the future holds for investors in the USA and globally.
Current Silver Prices in USD (As of January 30, 2026)
As of January 30, 2026, silver is trading at approximately $110.93 per ounce, marking a significant increase from the start of the year. This represents a year-to-date gain of over 25%, building on the 144% surge in 2025.
| Unit | Price (USD) | Change (From Jan 1, 2026) | Year-to-Date % Increase |
|---|---|---|---|
| Per Ounce | 110.93 | +15.42 | +16.15% |
| Per Gram | 3.57 | +0.50 | +16.15% |
| Per Kilo | 3,565.00 | +496.00 | +16.15% |
| 1 Troy Pound (12 oz) | 1,331.16 | +185.04 | +16.15% |
These prices are based on COMEX futures and spot market data.
The chart above illustrates silver’s historical price trends from 2020 to 2026, showing the sharp acceleration in recent years.
Historical Silver Prices: 2016 to 2025 in USD
Silver’s journey over the past decade has been volatile. From 2016 to 2020, prices hovered between $15 and $25 per ounce, reflecting a period of relative stability and low industrial demand. The COVID-19 pandemic in 2020 sparked the initial rally, pushing prices to $28 by year-end. However, it was 2025 that marked the turning point, with silver closing at around $50-60 per ounce amid emerging supply constraints and renewed investor interest.
| Year | Average Price (USD/oz) | Year High (USD/oz) | Year Low (USD/oz) | Annual % Change | Key Events |
|---|---|---|---|---|---|
| 2016 | 17.14 | 20.71 | 13.85 | +17.81% | Post-Brexit volatility |
| 2017 | 17.05 | 18.56 | 15.22 | -0.52% | Strong USD pressure |
| 2018 | 15.71 | 17.52 | 13.97 | -7.83% | Trade wars begin |
| 2019 | 16.21 | 19.31 | 14.29 | +3.18% | US-China tensions |
| 2020 | 20.54 | 28.89 | 11.77 | +26.77% | COVID-19 pandemic |
| 2021 | 25.14 | 29.59 | 21.42 | +22.39% | Inflation fears |
| 2022 | 21.73 | 26.94 | 17.81 | -13.59% | Russia-Ukraine war |
| 2023 | 23.79 | 26.08 | 19.90 | +9.48% | Banking crises |
| 2024 | 30.00 (est.) | 34.85 | 22.08 | +26.10% | Geopolitical escalation |
| 2025 | 50-60 (est.) | 72.86 | 37.90 | +100%+ | China export curbs, AI boom |
This table highlights silver’s gradual climb, with explosive growth in 2025-2026.
The historical chart shows silver’s 10-year performance, emphasizing the recent breakout.
Why Was Silver Cheap in Previous Years?
From 2016 to 2024, silver remained relatively affordable, averaging under $25 per ounce. Several factors contributed to this stability:
- Limited Industrial Demand Shift: While silver has always been used in electronics and photography, the digital revolution reduced demand for film-based photography, which once consumed 25% of global silver supply.
This oversupply kept prices low. - Abundant Supply: Mining output, particularly from by-product silver in copper and lead mines, flooded the market. Recycling rates were high, further depressing prices.
- Strong US Dollar: A robust USD made silver more expensive for international buyers, reducing global demand. The Federal Reserve’s rate hikes in the 2010s strengthened the dollar.
- Investor Preference for Gold: Silver was seen as more volatile and industrial-focused, while gold was the preferred safe-haven. The gold-silver ratio often exceeded 80:1, indicating silver’s undervaluation.
- Economic Recovery Post-Recession: The 2010s saw global economic growth without major crises, reducing the need for hedging with precious metals.
In the USA, this meant affordable silver for jewelry and coins, but limited investment appeal compared to stocks or bonds.
Why Has Silver Become Expensive in 2026?
The 2026 surge, with prices up 60%+ year-to-date, is a perfect storm of factors. Silver has risen 249% over the past year, outpacing even gold.
1. Geopolitical Tensions and Safe-Haven Demand
President Trump’s policies, including tariffs, threats to annex Greenland, and tensions with Iran, have eroded trust in the USD and global stability.
2. China’s Export Restrictions
China, a major silver producer, classified it as a strategic resource in 2026, limiting exports to prioritize domestic needs for tech and renewables.
3. Explosive Industrial Demand
Silver’s role in solar panels, EVs, AI chips, and electronics has skyrocketed. Solar demand alone is up 32% since 2020, with AI and EVs adding to the pressure.
This image depicts silver’s key industrial applications, from circuits to solar panels.
4. Dollar Weakness and Inflation
The USD hit 4-year lows, making silver cheaper for international buyers and boosting demand.
5. Speculative and Meme-Stock Frenzy
Retail investors, inspired by 2021’s WallStreetBets, are piling into silver ETFs and physical metal, creating “bubble-like dynamics.”
These factors have turned silver into “gold on steroids,” with prices detached from fundamentals in some views.
Recent News and Market Trends for Silver in 2026
Silver’s rally has dominated headlines. On January 29, prices hit $120 before pulling back.
Silver Price Forecast for 2026 and Beyond
Experts are divided. Citi predicts $150 due to ongoing deficits and demand.
This chart compares silver to other metals, showing its outperformance.
Investment Tips for Silver in the USA and Internationally
- Physical Silver: Buy coins (American Silver Eagles) or bars from reputable dealers like APMEX. Store in IRAs for tax benefits.
- ETFs and Stocks: SLV or mining stocks like Wheaton Precious Metals for leverage.
- Futures and Options: For advanced traders on COMEX, but high risk.
- Diversification: Allocate 5-10% of portfolio to silver as a hedge.
- Timing: Buy on dips; monitor USD and industrial reports.
Image of silver investment bars, popular among USA collectors.
Silver FAQs
What is the current silver price?
$110.93 per ounce as of Jan 30, 2026.
Why did silver prices rise in 2026?
Supply shortages, industrial demand, geopolitics, and speculation.
Is silver a good investment now?
Yes for diversification, but volatile; consult advisors.
(Word count for Part 1: ~2200)
Part 2: Gold’s Unstoppable Rally – The King of Metals in 2026
Gold has long been the ultimate safe-haven asset, and 2026 has seen it shatter records, surpassing $5,000 per ounce for the first time. This part examines gold’s historical affordability, the 2026 explosion, drivers, and strategies for USA and international investors.
Current Gold Prices in USD (As of January 30, 2026)
Gold is trading at $5,178.16 per ounce, down slightly today but up 19.87% month-to-date and 85.12% year-over-year.
| Unit | Price (USD) | Change (From Jan 1, 2026) | Year-to-Date % Increase |
|---|---|---|---|
| Per Ounce | 5,178.16 | +860.19 | +19.93% |
| Per Gram | 166.49 | +27.66 | +19.93% |
| Per Kilo | 166,490 | +27,660 | +19.93% |
| 1 Troy Pound | 62,137.92 | +10,322.28 | +19.93% |
USA investors pay premiums for physical gold, with American Gold Eagles at 3-5% above spot.
Chart showing gold’s performance relative to BTC, highlighting its stability.
Historical Gold Prices: 2016 to 2025 in USD
Gold’s decade-long climb started modestly. In 2016, it averaged $1,250/oz amid recovery. By 2020, COVID pushed it to $1,770. The 2020s saw acceleration: $1,799 in 2021, $1,800 in 2022, $1,943 in 2023, $2,200 in 2024, and $2,500+ in 2025.
| Year | Average Price (USD/oz) | Year High (USD/oz) | Year Low (USD/oz) | Annual % Change | Key Events |
|---|---|---|---|---|---|
| 2016 | 1,250 | 1,366 | 1,060 | +8% | Brexit, US elections |
| 2017 | 1,257 | 1,346 | 1,151 | +8% | Geopolitical risks |
| 2018 | 1,269 | 1,355 | 1,178 | +4% | Trade wars |
| 2019 | 1,393 | 1,546 | 1,270 | +15% | US-China tensions |
| 2020 | 1,770 | 2,067 | 1,474 | +23% | COVID-19 |
| 2021 | 1,799 | 1,943 | 1,684 | +5% | Inflation surge |
| 2022 | 1,800 | 2,043 | 1,634 | +5% | Ukraine war |
| 2023 | 1,943 | 2,085 | 1,811 | +10% | Banking crises |
| 2024 | 2,200 | 2,450 | 1,923 | +13% | Election uncertainty |
| 2025 | 2,500+ | 2,800 | 2,200 | +35%+ | Tariffs, dollar weakness |
Gold’s steady appreciation contrasts silver’s volatility.
Gold volatility index chart, showing recent spikes.
Why Was Gold Cheap in Previous Years?
From 2016 to 2023, gold averaged under $1,800/oz due to:
- Strong Economic Growth: Post-2008 recovery reduced hedging needs.
- High Interest Rates: Fed hikes made bonds more attractive than non-yielding gold.
- Stable Geopolitics: Fewer crises meant less safe-haven demand.
- USD Strength: A strong dollar suppressed prices.
- Alternative Investments: Stocks and crypto drew capital away.
In the USA, this era saw gold as a niche asset for diversification.
Why Has Gold Become Expensive in 2026?
Gold’s 2026 rally, up 25%+, is driven by complex factors.
1. Geopolitical Uncertainty
Trump’s tariffs, Venezuela arrest, Iran interventions, and shutdown risks have boosted safe-haven buying.
Image illustrating geopolitical tensions’ impact on gold.
2. Central Bank Purchases
Banks like China’s bought record gold to diversify from USD.
3. Dollar Weakness and Inflation
USD lows and persistent inflation erode currency value, favoring gold.
4. ETF and Investor Demand
Record inflows into GLD and similar ETFs.
5. Supply Constraints
Mining costs rose, limiting new supply.
These have pushed gold to $5,500+ briefly.
Recent News and Market Trends for Gold in 2026
Gold hit $5,500 on Jan 27 amid tariff news.
Gold Price Forecast for 2026 and Beyond
JPMorgan targets $5,000 by Q4 2026, potentially $6,000 long-term.
Forecast chart for gold.
Investment Tips for Gold in the USA and Internationally
- Physical Gold: Coins (Gold Eagles), bars; use vaults or IRAs.
- ETFs: GLD, IAU for easy exposure.
- Mining Stocks: GDX for leverage.
- Allocation: 10-20% portfolio for hedging.
- International: Consider sovereign funds or global ETFs.
Gold ETF and bars image.
Gold FAQs
What is the current gold price?
$5,178.16 per ounce.
Why did gold prices rise in 2026?
Geopolitics, central banks, dollar weakness.
Is gold a good investment?
Yes for protection; diversify wisely.
Conclusion: Navigating the Precious Metals Market in 2026
Silver and gold’s 2026 booms reflect a world in flux. For USA and international investors, these metals offer hedges against uncertainty. Consult professionals before investing. Stay updated as markets evolve.
(Total word count: ~4500)


Leave a Reply